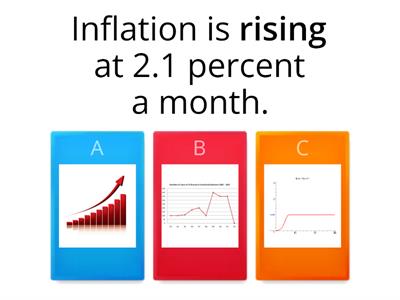
a continuous unbroken line in a graph. The data is shown by a __ on the chart., solid line, went above a certain number or level. Sales __ expectations last year., exceeded, a line made of dots to represent data. The forecast is shown with a __., dotted line, used to add extra information. __, the company expanded into new markets., in addition, became twice as much. Profits __ in just one year., doubled, increased very quickly and sharply. Demand __ in 2014., c, rose very fast. The number of users __ in a short time., shot up, increased to a very high level. Prices __ during the crisis., soared, increased strongly and suddenly. Sales __ in the final quarter., surged, became half as much. The population __ over the decade., halved, fell very quickly and sharply. The value __ in 2008., plummeted, dropped suddenly and dramatically. Profits __ last year., plunged, slightly, by a small amount. Sales increased __ in 2013., marginally, so small that it is not important. The figure changed __ over time., negligibly, very quickly. The market grew __ after 2010., rapidly, in a surprising or noticeable way. The results improved __., remarkably, in a very noticeable and clear way. The two trends were __ different., strikingly, very sharply (for rises or falls). Prices fell __ in 2012., steeply, staying the same over time. There was a __ increase in income., consistent, changed up and down and then became stable. Income __ over the period., fluctuated and then levelled off, reached the highest point. Sales __ in 2015., hit/reached a peak, fell a little and then improved again. Earnings __ in 2013., dipped slightly and recovered, stayed the same without change. The figure __ in the first three years., remained stable, rose gradually every year. Income __ over the decade., increased steadily year on year, reached the lowest point. Profits __ in 2009., hit a trough, became worse over time. Earnings __ in the last three years., worsened
0%
Graph
Jaga
Jaga
looja
Tusiachenko
Redigeeri sisu
Salvesta
Meeldib
Prindi
Manusta
Veel
Ülesandeid
Edetabel
Näita rohkem
Näita vähem
See edetabel on praegu privaatne. Selle avalikustamiseks klõpsake käsul
Jaga
.
Materjali omanik on selle edetabeli keelanud.
See edetabel on keelatud, kuna teie valikud erinevad materjali omaniku omadest.
Taasta valikud
Õpikaardid
on avatud mall. Sellega ei saa edetabeli punkte.
Sisselogimine on nõutud
Visuaalne stiil
Fondid
Vajalik tellimus
Valikud
Pigem nii
Business Vocab Builder 54.1 Describing trends
looja
Donaldson
Paaripanek
23
Business Vocab Builder 54.2 Describing trends
looja
Donaldson
Paaripanek
22
The story of money - quiz
looja
Calicnina
Pildiviktoriin
5
Describing Trends
looja
Donaldson
Rühmadesse sorteerimine
67
Vocabulary of Trends (Line graphs, IELTS)
looja
Shakhidamusaeva
Paaripanek
5
IELTS Writing Task 1 - Describing Trends (Vocabulary)
looja
Iamvasumahajan
Paaripanek
5
Describing trends
looja
Ceciliasaavedra
Viktoriin
6
IELTS writing task 1 - words describing trends
looja
Vngocanh2410
Viktoriin
6
Vaheta malli
Näita kõike
Avatud tulemused
Kopeeri link
QR-kood
Kustuta
Kas taastada automaatselt salvestatud
?