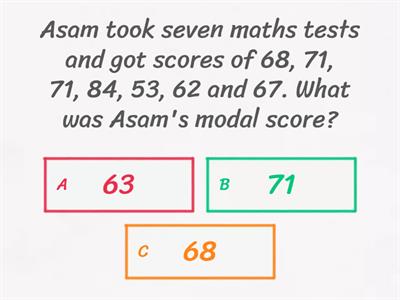
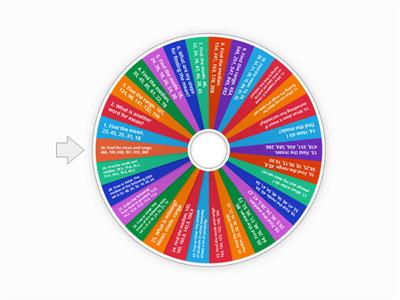
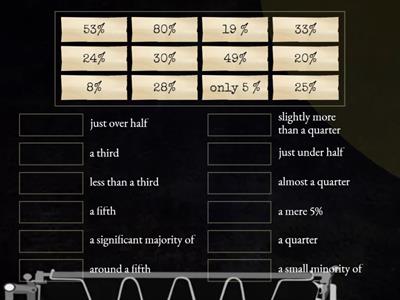
What is the average of 4, 8, 12?, 6, 8, 10, 12, What does a bar chart compare?, Data over time, Data categories, Data averages, Data percentages, What does a pictogram use?, Symbols, Numbers, Lines, Bars, What is 25% of a pie chart in degrees?, 45°, 90°, 180°, 270°, Convert 180° to a fraction of a pie chart., 1/2, 1/3, 1/4, 1/5, Convert 270° to a fraction of a pie chart., 1/5, 3/4, 1/7, 1/12, What is the average in 2, 3, 6, 9?, 5, 6, 9, None, What is 1/3 on a pie chart?, 3%, 33.3%, 1/3%, The average of three numbers is 8. What is the missing number? 1, 7, __, 8, 12, 16, You can not calculate the average of ..., eye colour, height, weight, arm span (length), This graph is a..., pictogram, pie chart, bar chart, trend/line graph, histogram, bar line graph, This graph is a..., pictogram, pie chart, bar chart, trend/line graph, histogram, bar line graph, This graph is a..., pictogram, pie chart, bar chart, trend/line graph, histogram, bar line graph, A trend graph is also called a ..., Z graph, line graph, What does a pie chart show?, Story order, Word meanings, Temperature change, Parts of whole, Which graph uses bars to show amounts?, Pie chart, Bar chart, Venn diagram, Line graph, Which graph shows change over time?, Line graph, Pictogram, Tally chart, Pie chart, What is the mode?, Middle value, Equal parts, Most common, Total sum, What is the median?, Most common, Total amount, Highest value, Middle value, What is the range?, Biggest minus smallest, Most repeated, All numbers added, Middle number, Find the mode: 3, 5, 5, 7., 15, 5, 7, 3, Find the median: 2, 4, 6., 2, 6, 4, 12, Find the range: 4, 9, 2, 10., 10, 6, 12, 8, A tally chart is used to?, Show fractions, Measure length, Count items, Write stories
0%
Data
Jaga
Jaga
looja
Marthagaughan15
Redigeeri sisu
Salvesta
Meeldib
Prindi
Manusta
Veel
Ülesandeid
Edetabel
Näita rohkem
Näita vähem
See edetabel on praegu privaatne. Selle avalikustamiseks klõpsake käsul
Jaga
.
Materjali omanik on selle edetabeli keelanud.
See edetabel on keelatud, kuna teie valikud erinevad materjali omaniku omadest.
Taasta valikud
Viktoriin
on avatud mall. Sellega ei saa edetabeli punkte.
Sisselogimine on nõutud
Visuaalne stiil
Fondid
Vajalik tellimus
Valikud
Pigem nii
Mean, Median, Mode, Range Quiz
looja
Rosie
Viktoriin
49
Mean, median, mode and range
looja
Claymorec
Paaripanek
30
Interpret a bar graph
looja
Sciencedept
Märgistatud diagramm
13
Mean, Median, Mode, & Range
looja
Joanna727
Juhuslik ratas
12
Mean, median, mode and Range
looja
Adefilippo1
Paaripanek
26
Pie Charts: how to describe figures?
looja
Infoyourielts
Paaripanek
11
Mean, Median, Mode and Range
looja
Claudette8
Leia sobiv
13
Reading charts - bar charts, pictograms, tally charts
looja
Millymollymandy
Viktoriin
57
AI täiustatud: See tegevus sisaldab tehisintellekti poolt genereeritud sisu.
Lisateave.
Vaheta malli
Näita kõike
Avatud tulemused
Kopeeri link
QR-kood
Kustuta
Kas taastada automaatselt salvestatud
?