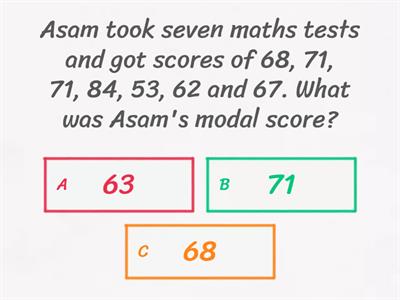
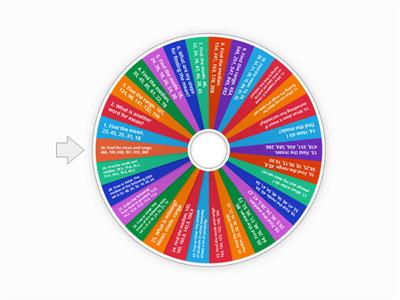
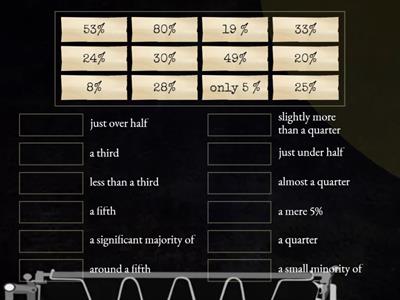
What is the average of 4, 8, 12?, 6, 8, 10, 12, What does a bar chart compare?, Data over time, Data categories, Data averages, Data percentages, What does a pictogram use?, Symbols, Numbers, Lines, Bars, What is 25% of a pie chart in degrees?, 45°, 90°, 180°, 270°, Convert 180° to a fraction of a pie chart., 1/2, 1/3, 1/4, 1/5, Convert 270° to a fraction of a pie chart., 1/5, 3/4, 1/7, 1/12, What is the average in 2, 3, 6, 9?, 5, 6, 9, None, What is 1/3 on a pie chart?, 3%, 33.3%, 1/3%, The average of three numbers is 8. What is the missing number? 1, 7, __, 8, 12, 16, You can not calculate the average of ..., eye colour, height, weight, arm span (length), This graph is a..., pictogram, pie chart, bar chart, trend/line graph, histogram, bar line graph, This graph is a..., pictogram, pie chart, bar chart, trend/line graph, histogram, bar line graph, This graph is a..., pictogram, pie chart, bar chart, trend/line graph, histogram, bar line graph, A trend graph is also called a ..., Z graph, line graph, What does a pie chart show?, Story order, Word meanings, Temperature change, Parts of whole, Which graph uses bars to show amounts?, Pie chart, Bar chart, Venn diagram, Line graph, Which graph shows change over time?, Line graph, Pictogram, Tally chart, Pie chart, What is the mode?, Middle value, Equal parts, Most common, Total sum, What is the median?, Most common, Total amount, Highest value, Middle value, What is the range?, Biggest minus smallest, Most repeated, All numbers added, Middle number, Find the mode: 3, 5, 5, 7., 15, 5, 7, 3, Find the median: 2, 4, 6., 2, 6, 4, 12, Find the range: 4, 9, 2, 10., 10, 6, 12, 8, A tally chart is used to?, Show fractions, Measure length, Count items, Write stories
0%
Data
Partager
Partager
par
Marthagaughan15
Modifier le contenu
Sauvegarder
Aime
Imprimer
Incorporer
Plus
Affectations
Classement
Afficher plus
Afficher moins
Ce classement est actuellement privé. Cliquez sur
Partager
pour le rendre public.
Ce classement a été désactivé par le propriétaire de la ressource.
Ce classement est désactivé car vos options sont différentes pour le propriétaire de la ressource.
Rétablir les Options
Quiz
est un modèle à composition non limitée. Il ne génère pas de points pour un classement.
Connexion requise
Style visuel
Polices
Abonnement requis
Options
Plutôt comme ça
Mean, Median, Mode, Range Quiz
par
Rosie
Quiz
49
Mean, median, mode and range
par
Claymorec
Apparier
30
Interpret a bar graph
par
Sciencedept
Diagramme étiqueté
13
Mean, Median, Mode, & Range
par
Joanna727
Roue aléatoire
12
Mean, median, mode and Range
par
Adefilippo1
Apparier
26
Pie Charts: how to describe figures?
par
Infoyourielts
Apparier
11
Mean, Median, Mode and Range
par
Claudette8
Trouver la correspondance
13
Reading charts - bar charts, pictograms, tally charts
par
Millymollymandy
Quiz
57
IA Améliorée : Cette activité contient du contenu généré par l’IA.
Pour en savoir plus.
Changer de modèle
Afficher tout
Ouvrir les résultats
Copier le lien
Code QR
Supprimer
Restauration auto-sauvegardé :
?