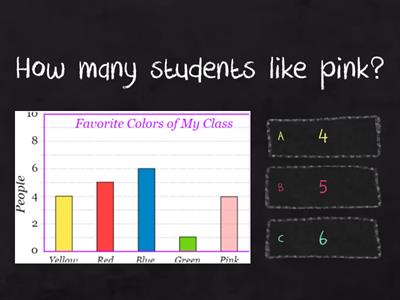
Which data display is best for comparing categories?, Pie Chart, Bar Graph, Line Graph, Stem-and-Leaf Plot, Which data display is best for showing change over time?, Bar Graph, Pie Chart, Line Graph, Frequency Table, Which data display shows parts of a whole?, Bar Graph, Histogram, Stem-and-Leaf Plot, Pie Chart, Which data display is usually created before drawing a graph?, Pie Chart, Line Graph, Frequency Table, Histogram, Which data display keeps every numerical value?, Bar Graph, Pie Chart, Stem-and-Leaf Plot, Line Graph, A survey asks students for their favourite sport. Which graph would be BEST?, Line Graph, Histogram, Bar Graph, Stem-and-Leaf Plot, A weather station records the temperature every day for one week. Which graph would be BEST?, Pie Chart, Bar Graph, Stem-and-Leaf Plot, Line Graph, Which of these is NOT needed on a good bar graph?, Title, Axis labels, Even scale, Connected bars
0%
Data display recap
공유
공유
만든이
Xtynieoz
콘텐츠 편집
저장
좋아요
인쇄
퍼가기
더보기
할당
순위표
더 보기
접기
이 순위표는 현재 비공개입니다.
공유
를 클릭하여 공개할 수 있습니다.
자료 소유자가 이 순위표를 비활성화했습니다.
옵션이 자료 소유자와 다르기 때문에 이 순위표가 비활성화됩니다.
옵션 되돌리기
게임쇼 퀴즈
(은)는 개방형 템플릿입니다. 순위표에 올라가는 점수를 산출하지 않습니다.
로그인이 필요합니다
비주얼 스타일
글꼴
구독 필요
옵션
이런 식으로 더 많아
Classify these charts and graphs:
만든이
Noelia4
매치업
14
Bar Graph Review
만든이
Mosssg
게임쇼 퀴즈
17
Bar Graph Questions
만든이
Ashleyletsos
퀴즈
87
Scatter Graphs Revision
만든이
Rsalthouse
퀴즈
8
Data Graphs
만든이
Ashialdayani
퀴즈
11
Graphs and charts
만든이
Rnorth2
퀴즈
16
Reading charts - bar charts, pictograms, tally charts
만든이
Millymollymandy
퀴즈
57
Representing Data - Lists, Tables, Tally Charts and Bar Charts
만든이
Lemerson
퀴즈
7
템플릿 전환하기
모두 표시
결과 열기
링크 복사
QR 코드
삭제
자동 저장된
게임을 복구할까요?