What is a bar chart?, A type of graph, A type of table, A type of text, A type of map, What does a histogram display?, Frequency distribution, Geographical data, Time series, Textual data, What is a pie chart used for?, Showing proportions, Showing trends, Showing locations, Showing timelines, How are bar chart values calculated?, By counting items, By measuring length, By weighing items, By timing events, What is the key feature of a histogram?, Continuous data, Categorical data, Random data, Text data, How do you calculate pie chart angles?, Using percentages, Using decimals, Using fractions, Using whole numbers, What does each bar in a bar chart represent?, A category, A time period, A location, A person, What is the sum of all angles in a pie chart?, 360 degrees, 180 degrees, 90 degrees, 270 degrees, What is the difference between bar charts and histograms?, Bar charts are for categories, Histograms are for categories, Bar charts are for time, Histograms are for time, What is the main use of a pie chart?, Comparing parts to a whole, Comparing time periods, Comparing locations, Comparing people, What type of data is best for bar charts?, Categorical data, Continuous data, Random data, Text data, How do you calculate the height of a bar in a bar chart?, Count occurrences, Measure length, Weigh items, Time events, What is the purpose of a histogram?, Show data distribution, Show data trends, Show data locations, Show data timelines, What is a key characteristic of pie charts?, Circular shape, Rectangular shape, Triangular shape, Square shape, How are sections in a pie chart determined?, By data proportion, By data length, By data weight, By data time, What does each section of a pie chart represent?, A data category, A data time, A data location, A data person, What is the main advantage of using bar charts?, Easy comparison, Easy calculation, Easy measurement, Easy timing, What is the main advantage of using histograms?, Show frequency distribution, Show geographical data, Show textual data, Show time series, What is the main advantage of using pie charts?, Visualize proportions, Visualize trends, Visualize locations, Visualize timelines, How do you determine the size of each slice in a pie chart?, Calculate percentage, Calculate length, Calculate weight, Calculate time
0%
Presenting data Grade 9
공유
공유
만든이
Bhebhemqondisi
Gr 9
Maths
콘텐츠 편집
저장
좋아요
인쇄
퍼가기
더보기
할당
순위표
더 보기
접기
이 순위표는 현재 비공개입니다.
공유
를 클릭하여 공개할 수 있습니다.
자료 소유자가 이 순위표를 비활성화했습니다.
옵션이 자료 소유자와 다르기 때문에 이 순위표가 비활성화됩니다.
옵션 되돌리기
퀴즈
(은)는 개방형 템플릿입니다. 순위표에 올라가는 점수를 산출하지 않습니다.
로그인이 필요합니다
비주얼 스타일
글꼴
구독 필요
옵션
이런 식으로 더 많아
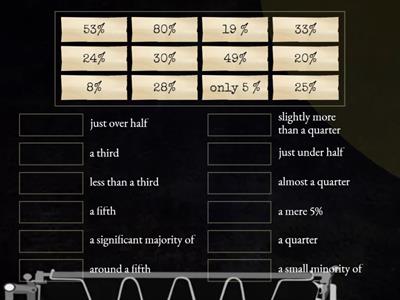
Classify these charts and graphs:
만든이
Noelia4
매치업
14
Writing task 1: bar chart
만든이
Maxromano
문장 완성
9
Reading Bar Graphs Review
만든이
Ainswaj
게임쇼 퀴즈
69
Pie Charts: how to describe figures?
만든이
Infoyourielts
매치업
11
Bar Graph Questions
만든이
Shonawright
퀴즈
43
Reading charts - bar charts, pictograms, tally charts (Entry 1-Entry 2)
만든이
Nicolacrabb
퀴즈
10
Pie Chart Quiz
만든이
Ncarbery
퀴즈
9
Reading charts - bar charts, pictograms, tally charts
만든이
Millymollymandy
퀴즈
57
AI 강화: 이 활동에는 AI가 생성한 콘텐츠가 포함되어 있습니다.
더 알아보세요.
템플릿 전환하기
모두 표시
결과 열기
링크 복사
QR 코드
삭제
자동 저장된
게임을 복구할까요?