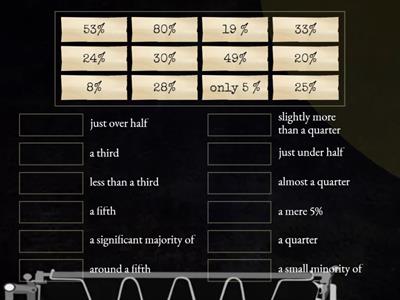
What is a bar chart?, A type of graph, A type of table, A type of text, A type of map, What does a histogram display?, Frequency distribution, Geographical data, Time series, Textual data, What is a pie chart used for?, Showing proportions, Showing trends, Showing locations, Showing timelines, How are bar chart values calculated?, By counting items, By measuring length, By weighing items, By timing events, What is the key feature of a histogram?, Continuous data, Categorical data, Random data, Text data, How do you calculate pie chart angles?, Using percentages, Using decimals, Using fractions, Using whole numbers, What does each bar in a bar chart represent?, A category, A time period, A location, A person, What is the sum of all angles in a pie chart?, 360 degrees, 180 degrees, 90 degrees, 270 degrees, What is the difference between bar charts and histograms?, Bar charts are for categories, Histograms are for categories, Bar charts are for time, Histograms are for time, What is the main use of a pie chart?, Comparing parts to a whole, Comparing time periods, Comparing locations, Comparing people, What type of data is best for bar charts?, Categorical data, Continuous data, Random data, Text data, How do you calculate the height of a bar in a bar chart?, Count occurrences, Measure length, Weigh items, Time events, What is the purpose of a histogram?, Show data distribution, Show data trends, Show data locations, Show data timelines, What is a key characteristic of pie charts?, Circular shape, Rectangular shape, Triangular shape, Square shape, How are sections in a pie chart determined?, By data proportion, By data length, By data weight, By data time, What does each section of a pie chart represent?, A data category, A data time, A data location, A data person, What is the main advantage of using bar charts?, Easy comparison, Easy calculation, Easy measurement, Easy timing, What is the main advantage of using histograms?, Show frequency distribution, Show geographical data, Show textual data, Show time series, What is the main advantage of using pie charts?, Visualize proportions, Visualize trends, Visualize locations, Visualize timelines, How do you determine the size of each slice in a pie chart?, Calculate percentage, Calculate length, Calculate weight, Calculate time
0%
Presenting data Grade 9
Kongsikan
Kongsikan
oleh
Bhebhemqondisi
Gr 9
Maths
Edit Kandungan
Simpan
Sukai
Cetakan
Benamkan
Lebih lagi
Tugasan
Papan mata
Paparkan banyak
Paparkan sedikit
Papan mata ini berciri peribadi pada masa ini. Klik
Kongsikan
untuk menjadikannya umum.
Papan mata ini telah dilumpuhkan oleh pemilik sumber.
Papan mata ini dinyahdayakan kerana pilihan anda berbeza daripada pemilik sumber.
Pilihan untuk Kembali
Kuiz
ialah templat terbuka. Ia tidak menjana skor untuk papan mata.
Log masuk diperlukan
Gaya visual
Fon
Langganan diperlukan
Pilihan
Lebih tepat seperti ini
Classify these charts and graphs:
oleh
Noelia4
Padankan
14
Writing task 1: bar chart
oleh
Maxromano
Lengkapkan ayat
9
Reading Bar Graphs Review
oleh
Ainswaj
Kuiz rancangan mainan
69
Pie Charts: how to describe figures?
oleh
Infoyourielts
Padankan
11
Bar Graph Questions
oleh
Shonawright
Kuiz
43
Reading charts - bar charts, pictograms, tally charts (Entry 1-Entry 2)
oleh
Nicolacrabb
Kuiz
10
Pie Chart Quiz
oleh
Ncarbery
Kuiz
9
Reading charts - bar charts, pictograms, tally charts
oleh
Millymollymandy
Kuiz
57
AI Dipertingkatkan: Aktiviti ini mengandungi kandungan yang dijana oleh AI.
Ketahui lebih lanjut.
Tukar templat
Paparkan semua
Buka keputusan
Salin pautan
Kod QR
Padam
Pulihkan autosimpan:
?