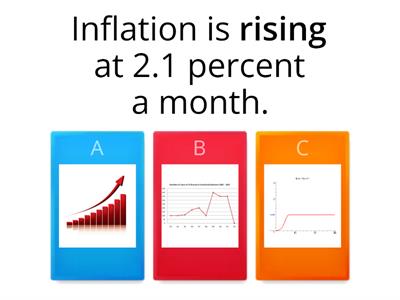
a continuous unbroken line in a graph. The data is shown by a __ on the chart., solid line, went above a certain number or level. Sales __ expectations last year., exceeded, a line made of dots to represent data. The forecast is shown with a __., dotted line, used to add extra information. __, the company expanded into new markets., in addition, became twice as much. Profits __ in just one year., doubled, increased very quickly and sharply. Demand __ in 2014., c, rose very fast. The number of users __ in a short time., shot up, increased to a very high level. Prices __ during the crisis., soared, increased strongly and suddenly. Sales __ in the final quarter., surged, became half as much. The population __ over the decade., halved, fell very quickly and sharply. The value __ in 2008., plummeted, dropped suddenly and dramatically. Profits __ last year., plunged, slightly, by a small amount. Sales increased __ in 2013., marginally, so small that it is not important. The figure changed __ over time., negligibly, very quickly. The market grew __ after 2010., rapidly, in a surprising or noticeable way. The results improved __., remarkably, in a very noticeable and clear way. The two trends were __ different., strikingly, very sharply (for rises or falls). Prices fell __ in 2012., steeply, staying the same over time. There was a __ increase in income., consistent, changed up and down and then became stable. Income __ over the period., fluctuated and then levelled off, reached the highest point. Sales __ in 2015., hit/reached a peak, fell a little and then improved again. Earnings __ in 2013., dipped slightly and recovered, stayed the same without change. The figure __ in the first three years., remained stable, rose gradually every year. Income __ over the decade., increased steadily year on year, reached the lowest point. Profits __ in 2009., hit a trough, became worse over time. Earnings __ in the last three years., worsened
0%
Graph
Del
Del
etter
Tusiachenko
Rediger innhold
Lagre
Som
Skriv ut
Innebygd
Mer
Tildelinger
Ledertavle
Vis mer
Vis mindre
Denne ledertavlen er for øyeblikket privat. Klikk
Share
for å gjøre den offentlig.
Denne ledertavlen er deaktivert av ressurseieren.
Denne ledertavlen er deaktivert fordi alternativene er forskjellige fra ressurseieren.
Alternativer for tilbakestilling
Flash-kort
er en åpen mal. Det genererer ikke poengsummer for en ledertavle.
Pålogging kreves
Visuell stil
Skrifter
Krever abonnement
Alternativer
Mer som dette
Business Vocab Builder 54.1 Describing trends
etter
Donaldson
Match opp
23
Business Vocab Builder 54.2 Describing trends
etter
Donaldson
Match opp
22
The story of money - quiz
etter
Calicnina
Bildequiz
5
Describing Trends
etter
Donaldson
Gruppe sortering
67
Vocabulary of Trends (Line graphs, IELTS)
etter
Shakhidamusaeva
Match opp
5
IELTS Writing Task 1 - Describing Trends (Vocabulary)
etter
Iamvasumahajan
Match opp
5
Describing trends
etter
Ceciliasaavedra
Spørrelek
6
IELTS writing task 1 - words describing trends
etter
Vngocanh2410
Spørrelek
6
Bytt mal
Vis alle
Åpne resultater
Kopier kobling
QR-kode
Slette
Gjenopprett automatisk lagring:
?