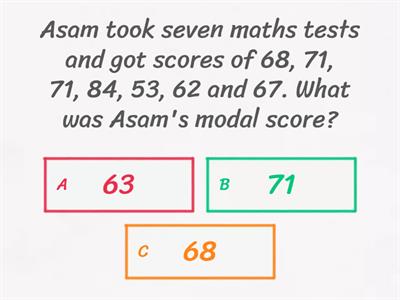
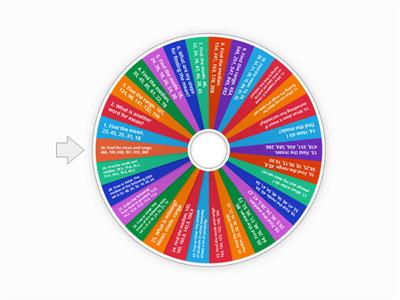
What is the average of 4, 8, 12?, 6, 8, 10, 12, What does a bar chart compare?, Data over time, Data categories, Data averages, Data percentages, What does a pictogram use?, Symbols, Numbers, Lines, Bars, What is 25% of a pie chart in degrees?, 45°, 90°, 180°, 270°, Convert 180° to a fraction of a pie chart., 1/2, 1/3, 1/4, 1/5, Convert 270° to a fraction of a pie chart., 1/5, 3/4, 1/7, 1/12, What is the average in 2, 3, 6, 9?, 5, 6, 9, None, What is 1/3 on a pie chart?, 3%, 33.3%, 1/3%, The average of three numbers is 8. What is the missing number? 1, 7, __, 8, 12, 16, You can not calculate the average of ..., eye colour, height, weight, arm span (length), This graph is a..., pictogram, pie chart, bar chart, trend/line graph, histogram, bar line graph, This graph is a..., pictogram, pie chart, bar chart, trend/line graph, histogram, bar line graph, This graph is a..., pictogram, pie chart, bar chart, trend/line graph, histogram, bar line graph, A trend graph is also called a ..., Z graph, line graph, What does a pie chart show?, Story order, Word meanings, Temperature change, Parts of whole, Which graph uses bars to show amounts?, Pie chart, Bar chart, Venn diagram, Line graph, Which graph shows change over time?, Line graph, Pictogram, Tally chart, Pie chart, What is the mode?, Middle value, Equal parts, Most common, Total sum, What is the median?, Most common, Total amount, Highest value, Middle value, What is the range?, Biggest minus smallest, Most repeated, All numbers added, Middle number, Find the mode: 3, 5, 5, 7., 15, 5, 7, 3, Find the median: 2, 4, 6., 2, 6, 4, 12, Find the range: 4, 9, 2, 10., 10, 6, 12, 8, A tally chart is used to?, Show fractions, Measure length, Count items, Write stories
0%
Data
Del
Del
etter
Marthagaughan15
Rediger innhold
Lagre
Som
Skriv ut
Innebygd
Mer
Tildelinger
Ledertavle
Vis mer
Vis mindre
Denne ledertavlen er for øyeblikket privat. Klikk
Share
for å gjøre den offentlig.
Denne ledertavlen er deaktivert av ressurseieren.
Denne ledertavlen er deaktivert fordi alternativene er forskjellige fra ressurseieren.
Alternativer for tilbakestilling
Spørrelek
er en åpen mal. Det genererer ikke poengsummer for en ledertavle.
Pålogging kreves
Visuell stil
Skrifter
Krever abonnement
Alternativer
Mer som dette
Mean, Median, Mode, Range Quiz
etter
Rosie
Spørrelek
49
Mean, median, mode and range
etter
Claymorec
Match opp
30
Interpret a bar graph
etter
Sciencedept
Merket diagram
13
Mean, Median, Mode, & Range
etter
Joanna727
Tilfeldig hjul
12
Mean, median, mode and Range
etter
Adefilippo1
Match opp
26
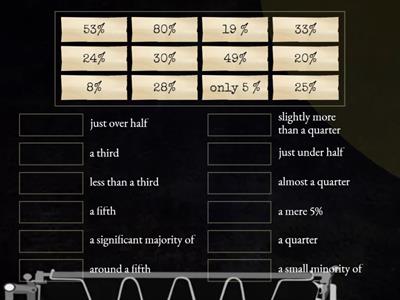
Pie Charts: how to describe figures?
etter
Infoyourielts
Match opp
11
Mean, Median, Mode and Range
etter
Claudette8
Finn treffet
13
Reading charts - bar charts, pictograms, tally charts
etter
Millymollymandy
Spørrelek
57
AI-forsterket: Denne aktiviteten inneholder innhold generert av AI.
Få mer informasjon.
Bytt mal
Vis alle
Åpne resultater
Kopier kobling
QR-kode
Slette
Gjenopprett automatisk lagring:
?