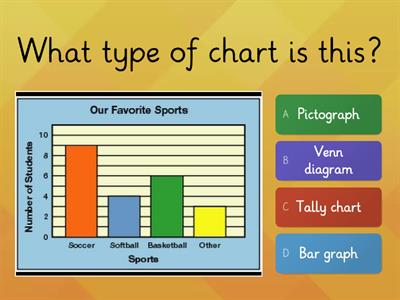
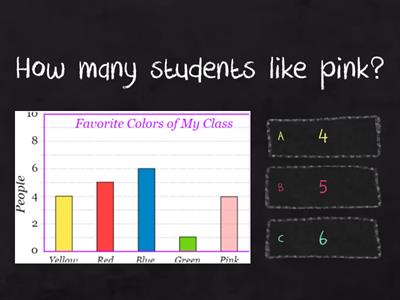
____________produced the most cars, Toyota, Hyundai, Volkswagen, ____________produced the least cars, Stellantis, Hyundai, Volkswagen, Hyundai produced __________million cars, 7, 6, 8, The total number of cars produced by all four automakers is_______________ million cars, 31, 32, 33, To show the data we collect, we can use a ________., bar graph, category, compare, We use a double bar graph to ________ groups., collect, compare, data, In the vocabulary task, boys and girls, or different sports, are examples of a ________., data, category, graph
0%
U14.3
Udostępnij
Udostępnij
autor:
Dangtulinh
Edytuj elementy
Zapisz
Polub
Drukuj
Osadź
Więcej
Zadania
Tabela rankingowa
Pokaż więcej
Pokaż mniej
Ta tabela rankingowa jest obecnie prywatna. Kliknij przycisk
Udostępnij
, aby ją upublicznić.
Ta tabela rankingowa została wyłączona przez właściciela materiału.
Ta tabela rankingowa została wyłączona, ponieważ Twoje opcje różnią się od opcji właściciela materiału.
Przywróć poprzednie opcje
Teleturniej
jest szablonem otwartym. Nie generuje wyników w tabeli rankingowej.
Wymagane logowanie
Motyw
Czcionki
Wymagany abonament
Opcje
Bardziej tak
Classify these charts and graphs:
autor:
Noelia4
Połącz w pary
14
Bar graph
autor:
Bukky
Test
41
Describing graphs
autor:
Sinyukovichn
Połącz w pary
9
Match the graphs
autor:
Smekki
Połącz w pary
8
Writing task 1: bar chart
autor:
Maxromano
Uzupełnij zdanie
9
Bar Graph Questions
autor:
Ashleyletsos
Test
87
G4統計圖表(長條圖)
autor:
T22432
Teleturniej
17
Bar Graph
autor:
Georgealvarez17
Test
19
Zmień szablon
Pokaż wszystko
Otwórz wyniki
Kopiuj link
Kod QR
Usuń
Przywrócić automatycznie zapisane ćwiczenie:
?