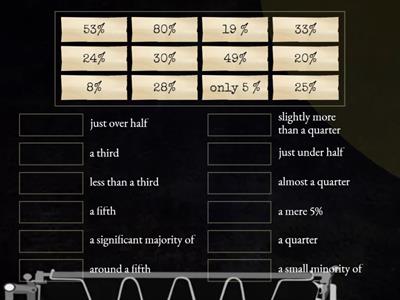
What is a bar chart?, A type of graph, A type of table, A type of text, A type of map, What does a histogram display?, Frequency distribution, Geographical data, Time series, Textual data, What is a pie chart used for?, Showing proportions, Showing trends, Showing locations, Showing timelines, How are bar chart values calculated?, By counting items, By measuring length, By weighing items, By timing events, What is the key feature of a histogram?, Continuous data, Categorical data, Random data, Text data, How do you calculate pie chart angles?, Using percentages, Using decimals, Using fractions, Using whole numbers, What does each bar in a bar chart represent?, A category, A time period, A location, A person, What is the sum of all angles in a pie chart?, 360 degrees, 180 degrees, 90 degrees, 270 degrees, What is the difference between bar charts and histograms?, Bar charts are for categories, Histograms are for categories, Bar charts are for time, Histograms are for time, What is the main use of a pie chart?, Comparing parts to a whole, Comparing time periods, Comparing locations, Comparing people, What type of data is best for bar charts?, Categorical data, Continuous data, Random data, Text data, How do you calculate the height of a bar in a bar chart?, Count occurrences, Measure length, Weigh items, Time events, What is the purpose of a histogram?, Show data distribution, Show data trends, Show data locations, Show data timelines, What is a key characteristic of pie charts?, Circular shape, Rectangular shape, Triangular shape, Square shape, How are sections in a pie chart determined?, By data proportion, By data length, By data weight, By data time, What does each section of a pie chart represent?, A data category, A data time, A data location, A data person, What is the main advantage of using bar charts?, Easy comparison, Easy calculation, Easy measurement, Easy timing, What is the main advantage of using histograms?, Show frequency distribution, Show geographical data, Show textual data, Show time series, What is the main advantage of using pie charts?, Visualize proportions, Visualize trends, Visualize locations, Visualize timelines, How do you determine the size of each slice in a pie chart?, Calculate percentage, Calculate length, Calculate weight, Calculate time
0%
Presenting data Grade 9
Udostępnij
Udostępnij
autor:
Bhebhemqondisi
Gr 9
Maths
Edytuj elementy
Zapisz
Polub
Drukuj
Osadź
Więcej
Zadania
Tabela rankingowa
Pokaż więcej
Pokaż mniej
Ta tabela rankingowa jest obecnie prywatna. Kliknij przycisk
Udostępnij
, aby ją upublicznić.
Ta tabela rankingowa została wyłączona przez właściciela materiału.
Ta tabela rankingowa została wyłączona, ponieważ Twoje opcje różnią się od opcji właściciela materiału.
Przywróć poprzednie opcje
Test
jest szablonem otwartym. Nie generuje wyników w tabeli rankingowej.
Wymagane logowanie
Motyw
Czcionki
Wymagany abonament
Opcje
Bardziej tak
Classify these charts and graphs:
autor:
Noelia4
Połącz w pary
14
Writing task 1: bar chart
autor:
Maxromano
Uzupełnij zdanie
9
Reading Bar Graphs Review
autor:
Ainswaj
Teleturniej
69
Pie Charts: how to describe figures?
autor:
Infoyourielts
Połącz w pary
11
Bar Graph Questions
autor:
Shonawright
Test
43
Reading charts - bar charts, pictograms, tally charts (Entry 1-Entry 2)
autor:
Nicolacrabb
Test
10
Pie Chart Quiz
autor:
Ncarbery
Test
9
Reading charts - bar charts, pictograms, tally charts
autor:
Millymollymandy
Test
57
AI Enhanced: Ta aktywność zawiera treści generowane przez AI.
Dowiedz się więcej.
Zmień szablon
Pokaż wszystko
Otwórz wyniki
Kopiuj link
Kod QR
Usuń
Przywrócić automatycznie zapisane ćwiczenie:
?