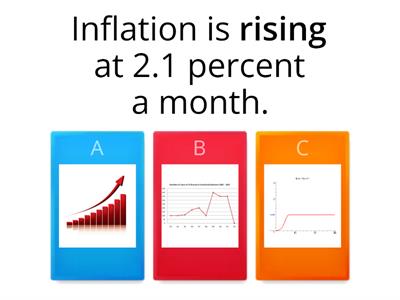
a continuous unbroken line in a graph. The data is shown by a __ on the chart., solid line, went above a certain number or level. Sales __ expectations last year., exceeded, a line made of dots to represent data. The forecast is shown with a __., dotted line, used to add extra information. __, the company expanded into new markets., in addition, became twice as much. Profits __ in just one year., doubled, increased very quickly and sharply. Demand __ in 2014., c, rose very fast. The number of users __ in a short time., shot up, increased to a very high level. Prices __ during the crisis., soared, increased strongly and suddenly. Sales __ in the final quarter., surged, became half as much. The population __ over the decade., halved, fell very quickly and sharply. The value __ in 2008., plummeted, dropped suddenly and dramatically. Profits __ last year., plunged, slightly, by a small amount. Sales increased __ in 2013., marginally, so small that it is not important. The figure changed __ over time., negligibly, very quickly. The market grew __ after 2010., rapidly, in a surprising or noticeable way. The results improved __., remarkably, in a very noticeable and clear way. The two trends were __ different., strikingly, very sharply (for rises or falls). Prices fell __ in 2012., steeply, staying the same over time. There was a __ increase in income., consistent, changed up and down and then became stable. Income __ over the period., fluctuated and then levelled off, reached the highest point. Sales __ in 2015., hit/reached a peak, fell a little and then improved again. Earnings __ in 2013., dipped slightly and recovered, stayed the same without change. The figure __ in the first three years., remained stable, rose gradually every year. Income __ over the decade., increased steadily year on year, reached the lowest point. Profits __ in 2009., hit a trough, became worse over time. Earnings __ in the last three years., worsened
0%
Graph
Поделиться
Поделиться
от
Tusiachenko
Редактировать контент
Сохранить
Подобные
Печать
Внедрить
Больше
Задания
Таблица лидеров
Показать больше
Показать меньше
Эта таблица лидеров в настоящее время является частной. Нажмите
Поделиться
, чтобы сделать ее общедоступной.
Эта таблица лидеров была отключена владельцем ресурса.
Эта таблица лидеров отключена, так как у вас и у владельца ресурса разные значения параметров.
Варианты отмены изменения
Флэш-карты
— это открытый шаблон. Он не создает баллы для таблицы лидеров.
Требуется вход в систему
Визуальный стиль
Шрифты
Требуется подписка
Параметры
Больше похоже на это
Business Vocab Builder 54.1 Describing trends
от
Donaldson
Сопоставить
23
Business Vocab Builder 54.2 Describing trends
от
Donaldson
Сопоставить
22
The story of money - quiz
от
Calicnina
Викторина с изображением
5
Describing Trends
от
Donaldson
Групповая сортировка
67
Vocabulary of Trends (Line graphs, IELTS)
от
Shakhidamusaeva
Сопоставить
5
IELTS Writing Task 1 - Describing Trends (Vocabulary)
от
Iamvasumahajan
Сопоставить
5
Describing trends
от
Ceciliasaavedra
Викторина
6
IELTS writing task 1 - words describing trends
от
Vngocanh2410
Викторина
6
Переключить шаблон
Показать все
Открыть результаты
Скопировать ссылку
QR-код
Удалить
Восстановить автоматически сохраненное:
?