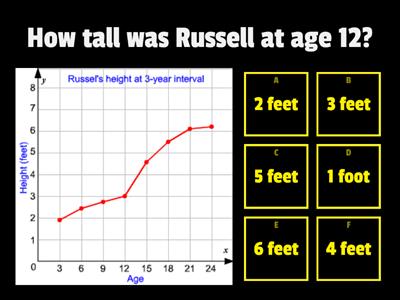
Shows what the graph is all about, X-axis (horizontal axis), Two data lines, Title, Legend, Shows the time period (days, month, weeks), Two data lines, X-axis (horizontal axis), Y-axis (vertical axis), Legend, Shows the values being measured (temperature, number of sales, scores), Y-axis (vertical axis), Title, X-axis (horizontal axis), Legend, Each line represents one group, Legend, Title, Y-axis (vertical axis), Two data lines, Identifies which color or symbol belongs to which data group, Y-axis (vertical axis), Two data lines, Legend, X-axis (horizontal axis)
0%
graph
共用
共用
由
Noravicoma
編輯內容
存檔
喜歡
列印
嵌入
更多
需要登錄
視覺風格
顯示所有
字體
活動設定
排行榜
作業
需要訂閱
活動設定
排行榜
此排行榜當前是私有的。單擊
共用
使其公開。
資源擁有者已禁用此排行榜。
此排行榜被禁用,因為您的選項與資源擁有者不同。
還原選項
顯示更多
顯示更少
開箱遊戲
是一個開放式範本。它不會為排行榜生成分數。
作業
您尚未與學生分享任何活動
要開始收集結果,請轉到任何活動頁面,然後選擇
Set assignment(設置分配
)。
確認您的設置並與學生共用生成的連結。
課業分配
更像這樣
Line Plot
由
Michaelkoppe
問答遊戲
74
Graphing and Data
由
Saraarguello
測驗
49
Graphing and Data
由
Saraarguello
測驗
55
Graph and chart
由
Beesmartyar
標籤圖表
6
Interpret Line Graphs
由
Martinel
測驗
28
Line graph
由
Ttsarapkina
標籤圖表
6
Data Graphs
由
Ashialdayani
測驗
11
Interpret Line Graphs 10.22
由
Nikecole2020
測驗
11
切換範本
顯示所有
打開結果
複製連結
QR 代碼
刪除
恢復自動保存:
?