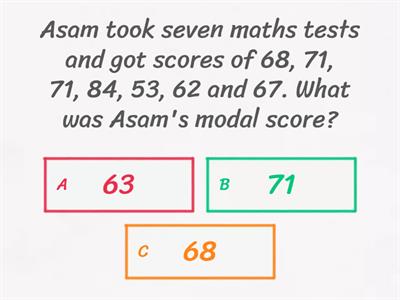
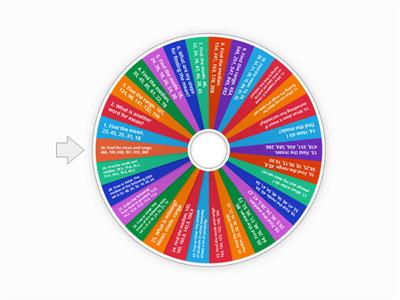
What is the average of 4, 8, 12?, 6, 8, 10, 12, What does a bar chart compare?, Data over time, Data categories, Data averages, Data percentages, What does a pictogram use?, Symbols, Numbers, Lines, Bars, What is 25% of a pie chart in degrees?, 45°, 90°, 180°, 270°, Convert 180° to a fraction of a pie chart., 1/2, 1/3, 1/4, 1/5, Convert 270° to a fraction of a pie chart., 1/5, 3/4, 1/7, 1/12, What is the average in 2, 3, 6, 9?, 5, 6, 9, None, What is 1/3 on a pie chart?, 3%, 33.3%, 1/3%, The average of three numbers is 8. What is the missing number? 1, 7, __, 8, 12, 16, You can not calculate the average of ..., eye colour, height, weight, arm span (length), This graph is a..., pictogram, pie chart, bar chart, trend/line graph, histogram, bar line graph, This graph is a..., pictogram, pie chart, bar chart, trend/line graph, histogram, bar line graph, This graph is a..., pictogram, pie chart, bar chart, trend/line graph, histogram, bar line graph, A trend graph is also called a ..., Z graph, line graph, What does a pie chart show?, Story order, Word meanings, Temperature change, Parts of whole, Which graph uses bars to show amounts?, Pie chart, Bar chart, Venn diagram, Line graph, Which graph shows change over time?, Line graph, Pictogram, Tally chart, Pie chart, What is the mode?, Middle value, Equal parts, Most common, Total sum, What is the median?, Most common, Total amount, Highest value, Middle value, What is the range?, Biggest minus smallest, Most repeated, All numbers added, Middle number, Find the mode: 3, 5, 5, 7., 15, 5, 7, 3, Find the median: 2, 4, 6., 2, 6, 4, 12, Find the range: 4, 9, 2, 10., 10, 6, 12, 8, A tally chart is used to?, Show fractions, Measure length, Count items, Write stories
0%
Data
Bendrinti
Bendrinti
prie
Marthagaughan15
Redaguoti turinį
Išsaugoti
Patinka
Spausdinti
Įterpti
Daugiau
Užduotis
Lyderių lentelė
Rodyti daugiau
Rodyti mažiau
Ši lyderių lentelė šiuo metu yra privati. Spustelėkite
Bendrinti
, kad ji būtų vieša.
Ši lyderių lentelė buvo išjungta išteklių savininko.
Ši lyderių lentelė yra išjungta, nes jūsų parinktys skiriasi nuo nustatytų išteklių savininko.
Grąžinti parinktis
Viktorina
yra neterminuotas šablonas. Jis negeneruoja rezultatų lyedrių lentelei.
Reikia prisijungti
Vizualinis stilius
Šriftai
Būtina prenumerata
Parinktys
Labiau taip.
Mean, Median, Mode, Range Quiz
prie
Rosie
Viktorina
49
Mean, median, mode and range
prie
Claymorec
Rask tinkamą
30
Interpret a bar graph
prie
Sciencedept
Diagrama su kortelėmis
13
Mean, Median, Mode, & Range
prie
Joanna727
Laimės ratas
12
Mean, median, mode and Range
prie
Adefilippo1
Rask tinkamą
26
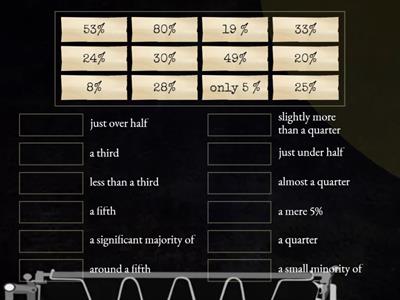
Pie Charts: how to describe figures?
prie
Infoyourielts
Rask tinkamą
11
Mean, Median, Mode and Range
prie
Claudette8
Rasti tinkamą
13
Reading charts - bar charts, pictograms, tally charts
prie
Millymollymandy
Viktorina
57
Patobulintas dirbtinis intelektas: šioje veikloje yra dirbtinio intelekto sugeneruoto turinio.
Sužinoti daugiau, sužinok daugiau.
Pakeisti šabloną
Rodyti viską
Atviri rezultatai
Kopijuoti nuorodą
QR kodas
Naikinti
Atkurti automatiškai įrašytą:
?