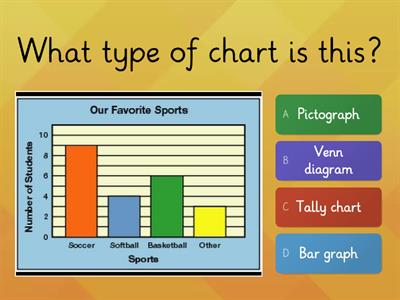
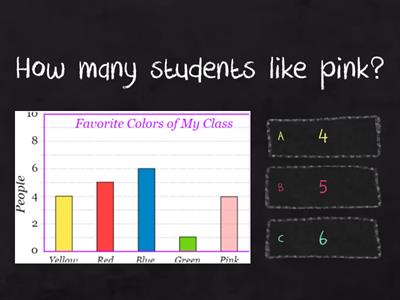
____________produced the most cars, Toyota, Hyundai, Volkswagen, ____________produced the least cars, Stellantis, Hyundai, Volkswagen, Hyundai produced __________million cars, 7, 6, 8, The total number of cars produced by all four automakers is_______________ million cars, 31, 32, 33, To show the data we collect, we can use a ________., bar graph, category, compare, We use a double bar graph to ________ groups., collect, compare, data, In the vocabulary task, boys and girls, or different sports, are examples of a ________., data, category, graph
0%
U14.3
Share
Share
by
Dangtulinh
Edit Content
Save
Like
Print
Embed
More
Assignments
Leaderboard
Show more
Show less
This leaderboard is currently private. Click
Share
to make it public.
This leaderboard has been disabled by the resource owner.
This leaderboard is disabled as your options are different to the resource owner.
Revert Options
Gameshow quiz
is an open-ended template. It does not generate scores for a leaderboard.
Log in required
Visual style
Fonts
Subscription required
Options
More like this
Classify these charts and graphs:
by
Noelia4
Match up
14
Bar graph
by
Bukky
Quiz
41
Describing graphs
by
Sinyukovichn
Match up
9
Match the graphs
by
Smekki
Match up
8
Writing task 1: bar chart
by
Maxromano
Complete the sentence
9
Bar Graph Questions
by
Ashleyletsos
Quiz
87
G4統計圖表(長條圖)
by
T22432
Gameshow quiz
17
Bar Graph
by
Georgealvarez17
Quiz
19
Switch template
Show all
Open results
Copy link
QR code
Delete
Continue editing:
?